Data Science
https://en.wikipedia.org/wiki/Data_science
-
Open Science
Scientific Method
-
CoCalc (SageMath)
Jupyter Extensions
datasciencemasters.org
Ten Simple Rules
#TenSimpleRules for Reproducible Computational Research
For Every Result, Keep Track of How It Was Produced
Avoid Manual Data Manipulation Steps
Archive the Exact Versions of All External Programs Used
Version Control All Custom Scripts
Record All Intermediate Results, When Possible in Standardized Formats
For Analyses That Include Randomness, Note Underlying Random Seeds
Always Store Raw Data behind Plots
Generate Hierarchical Analysis Output, Allowing Layers of Increasing Detail to Be Inspected
Connect Textual Statements to Underlying Results
Provide Public Access to Scripts, Runs, and Results
For Every Result, Keep Track of How It Was Produced
Workflow
Avoid Manual Data Manipulation Steps
Workflow
Data pipelines composed of containers
Archive the Exact Versions of All External Programs Used
Jupyter and Reproducibility (
%version_information,%watermark) (should be “Reproducibility and Jupyter Notebook”)
Version Control All Custom Scripts
Record All Intermediate Results, When Possible in Standardized Formats
Linked Data (e.g. 5 ★ Linked Open Data)
For Analyses That Include Randomness, Note Underlying Random Seeds
Python random functions:
print(os.environ['PYTHONHASHSEED'])
RANDOMSEED = 1  # /dev/[x]random

import random
random.seed(RANDOMSEED)

import numpy as np
np.random.seed(RANDOMSEED)    # Seed
print(np.random.get_state())  # State
np.random.rand(4, 2) # (rows, cols, [...])
np.random.randn(4, 2) # "standard normal" distribution
Python hash randomization and algorithmic determinism:
Always Store Raw Data behind Plots
Or, “Generate all plots from [source-controlled] [transforms-of] raw data”
./data./tests/data./nb/data(./notebooks)
Generate Hierarchical Analysis Output, Allowing Layers of Increasing Detail to Be Inspected
SKOS:
skos:narrower,skos:narrowerTransitive,skos:broader,skos:broaderTransistive, […]XKOS: “An SKOS extension for representing statistical classifications”
RDF Data Cubes: “The RDF Data Cube Vocabulary”
qb:DataSet,qb:Dimension,qb:ObservationGroup,qb:Slice, […]
Connect Textual Statements to Underlying Results
Linked Data: URIs, URLs,
#uri-fragments-
http://sphinx-doc.org/rest.html#footnotes #citations #substitutions
Linked Reproducibility: URIs, URLs,
#uri-fragments
Provide Public Access to Scripts, Runs, and Results
BinderHub
https://en.wikipedia.org/wiki/Comparison_of_source_code_hosting_facilities
BitBucket: hg: Mercurial, Git
#TenSimpleRules for Creating a Good Data Management Plan
Determine the Research Sponsor Requirements
Identify the Data to Be Collected
Define How the Data Will Be Organized
Explain How the Data Will Be Documented
Describe How Data Quality Will Be Assured
Present a Sound Data Storage and Preservation Strategy
Define the Project’s Data Policies
Describe How the Data Will Be Disseminated
Assign Roles and Responsibilities
Prepare a Realistic Budget
http://journals.plos.org/plosone/s/data-availability
> PLOS journals require authors to make all data underlying the findings described in their manuscript fully available without restriction, with rare exception.
Data, Information, Knowledge, & Wisdom
https://en.wikipedia.org/wiki/Data
https://en.wikipedia.org/wiki/Information
https://en.wikipedia.org/wiki/Knowledge (see: Knowledge Engineering)
https://en.wikipedia.org/wiki/Wisdom
# Lead -> Gold
Data is information
Information is data
Raw data is not knowledge
Wisdom compares knowledges
Optimization
https://en.wikipedia.org/wiki/Mathematical_optimization
Find local and global optima (maxima and minima) within an n-dimensional field which may be limited by resource constraints.
# Global optima of a 1-dimensional list
points = [10, 20, 100, 20, 10]
global_max, global_min = max(points), min(points)
assert global_max == 100
assert global_min == 10

# Local optima of a 1-dimensional list
sample = points[:1]
local_max, local_min = max(sample), min(sample)
assert local_max == 20
assert local_min == 10

# A 2-dimensional list ...
points = [(-0.5, 0),
          (0,  0.5),
          (0.5,  0),
          (0, -0.5)]
Smoothies
Data
Inputs, Outputs
Revenue:
2014-01-01 1200 CDT  $80
2014-01-01 1210 CDT  $100
2014-01-01 1500 CDT  $20
Expenses:
2014-01-01 wages     $256 ($8/hr * 8hrs * 4 people)
2014-01-01 utilities $100
Information
Aggregations, Tendencies
Revenue (gross):
2014-01-01 total: $200
Expenses:
2014-01-01 total: $356
Net:
2013-01-01  net:  -$200
2014-01-01  net:  -$156
On Mondays, we usually (on (simple) average) make about $500.
Knowledge
Positive net revenue is good.
One customer is worth the world to us.
Wisdom
We could save money by not being open on New Years Day, but, our loyal customers would not be happy about that.
Body Temperature
Data
time, body temp, outdoor temp, indoors/outdoors
time, exercise type, intensity, duration
Information
Daily temperature variance is about n degrees
Knowledge
Walking outside when it is warm increases body temperature
Walking outside when it is cold decreases body temperature
Exercise increases body temperature
Wisdom
If it’s 1745, and body temperature is n degrees above baseline, I’m probably walking outside and it is hot out.
Theory
Science
https://en.wikipedia.org/wiki/Outline_of_science
https://en.wikipedia.org/wiki/Category:Science
Cognitive Biases
https://en.wikipedia.org/wiki/Heuristics_in_judgment_and_decision-making
https://en.wikipedia.org/wiki/List_of_cognitive_biases
https://en.wikipedia.org/wiki/Controlling_for_a_variable
“distance walked per day”
“sports played” (sport, years)
Open Science
Scientific Method
https://en.wikipedia.org/wiki/Argument
https://en.wikipedia.org/wiki/Empirical_evidence
https://en.wikipedia.org/wiki/Hypothesis
https://en.wikipedia.org/wiki/Statistical_hypothesis_testing
https://en.wikipedia.org/wiki/Dependent_and_independent_variables
Reproducibility
See:
Systematic Review
Meta-analysis
Linked Reproducibility
#LinkedReproducibilityNote
This heading is now merged into a separate page: LinkedReproducibility
Math
https://en.wikipedia.org/wiki/Mathematics
https://en.wikipedia.org/wiki/Outline_of_mathematics
https://en.wikipedia.org/wiki/Mathematics_education#Methods
Math Courses
“Mathematics for Computer Science” (CC-BY-SA 3.0)
https://en.wikipedia.org/wiki/Kaggle#How_Kaggle_competitions_work
Project Euler
Project Euler is an very well-known set of math algorithm problems with free online grading.
Rosalind
Rosalind hosts a number of Python-based Bioinformatics and Data Science Problems and Exercises with free online grading.
Mathematical Notation
https://en.wikipedia.org/wiki/Outline_of_mathematics#Mathematical_notation
https://en.wikipedia.org/wiki/List_of_mathematical_symbols_by_subject
https://en.wikipedia.org/wiki/Greek_letters_used_in_mathematics,_science,_and_engineering
https://en.wikipedia.org/wiki/Latin_letters_used_in_mathematics
See:
Units > Units and RDF
LaTeX
“A Primer on Using LaTeX in Jupyter Notebooks” http://data-blog.udacity.com/posts/2016/10/latex-primer/
https://en.wikipedia.org/wiki/Comparison_of_TeX_editors
https://twitter.com/wstein389/status/1002446637908811776
Completely new LaTeX editor in https://cocalc.com . Open source, is written in React, has unlimited multipanel views, realtime collab, records all edits (TimeTravel), forward an inverse search, clickable links in the PDF,supports SageTex out of the box, and autoformat…
latex2sympy
latex2sympy converts from LaTeX to Python code that works with the SymPy CAS (Computer Algebra System).
latex2sympy is now integrated with SymPy as
sympy.parsing.latex.parse_latex: https://docs.sympy.org/latest/modules/parsing.html#! pip install -y antlr4-python3-runtime #! conda install -y antlr-python-runtime from sympy.parsing.latex import parse_latex parse_latex(r'\frac{n(n+1)(2n+1)}{6}') # ((2*n + 1)*n(n + 1))/6 parse_latex(r'\prod\limits_{i=1}^n x = x^n') # LaTeXParsingError: I don't understand this # \prod\limits_{i=1}^n x = x^n # ~~~~~^
MathJax
MathJax is a Javascript library for displaying MathML, LaTeX, and ASCIIMathML markup in a browser.
Jupyter and LaTeX
Jupyter Notebook supports a number of different ways to include LaTeX/MathTeX in a notebook with MathJax:
In a Markdown cell, wrap the LaTeX in double dollar signs:
$$:$$c = \sqrt{a^2 + b^2}$$ Note that these render differently: $$x = share price_today^2 $$ $$x = {share price}_{today}^2 $$ $$x = \text{share price}_{today}^2 $$ $$x = \textit{share price}_{today}^2 $$To display a LaTeX expression inline (without surrounding newline), wrap it in single dollar signs:
$:The quadratic equation, $c = \sqrt{a^2 + b^2}$, looks curiously like the quantum probability amplitude equation.To display multiple regular dollar signs, escape them with double-backslash
\\:One dollar sign: \\$ and another \\$
Start a Markdown cell with
%%latex:%%latex c = \sqrt{a^2 + b^2}Wrap a latex block with
$and\begin{align}:$ \begin{align} \textit{Earnings Per Share} & = \frac{\textit{Earnings}}{\textit{Market Value Per Share}} \\ \textit{EPS} & = \frac{\textit{Earnings}}{\textit{Share Price}} \end{align} $Call the
display()function with one or more Math/Latex objects, or just return aMath/Latexobject:from IPython.display import Math Math(r'c = \sqrt{a^2 + b^2}')
from IPython.display import Math, Latex, display
display(
   Math(r'c = \sqrt{a^2 + b^2}'),
   Latex(r'''\begin{align}''' +'\n'+ 'y = mx+b' +'\n'+ '\end{align}')))
MathML
ASCIIMathML
Information Theory
https://en.wikipedia.org/wiki/Information_theory
https://en.wikipedia.org/wiki/Entropy_(information_theory)
https://en.wikipedia.org/wiki/Signal_(electrical_engineering)
https://en.wikipedia.org/wiki/Noise_(signal_processing)
https://en.wikipedia.org/wiki/Signal-to-noise_ratio
Linear Algebra
https://en.wikipedia.org/wiki/Linear_algebra
Linear Algebra Software
https://docs.scipy.org/doc/numpy/reference/routines.linalg.html
https://docs.scipy.org/doc/scipy/reference/tutorial/linalg.html
https://docs.sympy.org/latest/modules/matrices/matrices.html
http://scipy-lectures.org/intro/numpy/operations.html#broadcasting

-
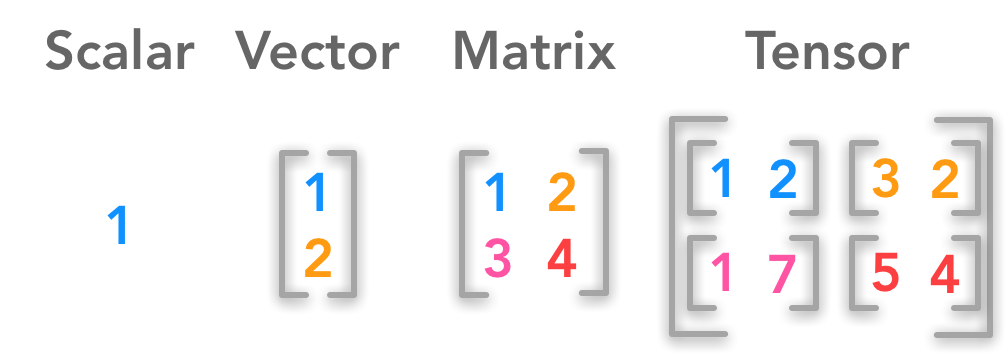
Scalar, Vector, Matrix, Tensor:
http://deeplearning.net/software/theano/library/tensor/basic.html#linear-algebra
Calculus
https://en.wikipedia.org/wiki/Calculus
Calculus Software
Statistics
https://en.wikipedia.org/wiki/Statistics
https://en.wikipedia.org/wiki/Outline_of_statistics
https://en.wikipedia.org/wiki/Category:Statistics
https://en.wikipedia.org/wiki/Notation_in_probability_and_statistics
http://apcentral.collegeboard.com/apc/public/courses/teachers_corner/2151.html
Parametric Statistics
https://en.wikipedia.org/wiki/Parametric_statistics
Regression Analysis
Nonparametric Statistics
https://en.wikipedia.org/wiki/Nonparametric_statistics
Descriptive Statistics
Statistical Inference
Causality
https://en.wikipedia.org/wiki/Causality
https://en.wikipedia.org/wiki/Correlation_and_dependence
https://en.wikipedia.org/wiki/Correlation_does_not_imply_causation
https://en.wikipedia.org/wiki/Sensitivity_analysis
https://en.wikipedia.org/wiki/Receiver_operating_characteristic
Probability and Statistics Software
Analysis
https://en.wikipedia.org/wiki/Data_analysis
https://en.wikipedia.org/wiki/Big_data
https://en.wikipedia.org/wiki/Data_processing#Data_processing_functions
Learning
https://en.wikipedia.org/wiki/Learning
https://en.wikipedia.org/wiki/Autodidacticism
https://en.wikipedia.org/wiki/Perceptual_learning
https://en.wikipedia.org/wiki/Pattern_recognition_(psychology)#False_pattern_recognition
https://en.wikipedia.org/wiki/Rhetoric
https://en.wikipedia.org/wiki/Socratic_method
https://en.wikipedia.org/wiki/Socratic_questioning
https://en.wikipedia.org/wiki/Platonic_dialogue#The_dialogues
https://en.wikipedia.org/wiki/Dialectic
https://en.wikipedia.org/wiki/Dialogue
https://en.wikipedia.org/wiki/Perturbation_theory_(quantum_mechanics)
https://en.wikipedia.org/wiki/Validated_learning
Data Mining
https://en.wikipedia.org/wiki/Data_mining
Data Dredging
!
spurious correlations
Machine Learning
Deep Learning
Datasets
awesome-public-datasets
Awesome
Tools
ETL
Workflow
Units of measure
I/O Transforms of information(/energy)
“Data Provenance”, “Data Lineage”
W3C PROV Provenance Ontology
See:
Techniques
Automated Workflows
Standard, Automated Workflows
Q: Is there confirmation bias in starting with e.g. simple regression analysis?
Q: Which factors did we know we were capturing?
5 ★ Linked Open Data
http://www.w3.org/TR/ld-glossary/#x5-star-linked-open-data
☆
Publish data on the Web in any format (e.g., PDF, JPEG) accompanied by an explicit Open License (expression of rights).
☆☆
Publish structured data on the Web in a machine-readable format (e.g. XML).
☆☆☆
Publish structured data on the Web in a documented, non-proprietary data format (e.g. CSV, KML).
☆☆☆☆
Publish structured data on the Web as RDF (e.g. Turtle, RDFa, JSON-LD, SPARQL.)
☆☆☆☆☆
In your RDF, have the identifiers be links (URLs) to useful data sources.
Data Visualization
Visualizing Data Science
The Data Science Venn Diagram
http://drewconway.com/zia/2013/3/26/the-data-science-venn-diagram
http://datascienceassn.org/content/fourth-bubble-data-science-venn-diagram-social-sciences
Field representations
Data Visualization Tools
https://github.com/sorrycc/awesome-javascript#data-visualization
https://pandas.pydata.org/pandas-docs/stable/ecosystem.html#visualization
Matplotlib
ref:Scipy lectures:
http://scipy-lectures.github.io/intro/matplotlib/matplotlib.html
Scientific-python-lectures:
http://tonysyu.github.com/mpltools/auto_examples/index.html#style-package
http://mpld3.github.io/ (Matplotlib + D3.js)
.
pandas plot functions generate matplotlib charts.
Seaborn
“Seaborn is a Python visualization library based on Matplotlib. It provides a high-level interface for drawing attractive statistical graphics.”
Mayavi
“Mayavi: 3D scientific data visualization and plotting in Python”
ref:Scipy lectures:
Bokeh
VisPy
Vega
Vincent
Plotly
PyQtGraph
qgrid
(SlickGrid w/ IPython Notebook/ Jupyter Notebook
pandas support
D3.js
Three.js
(WebGL)
Google ARCore Web is built on Three.js
React VR is built on Three.js
Sigmajs
Graphs in Javascript
See Also
Machine Learning